


Web App / UX Case Study
A timeline creation platform that transforms hours of manual work into minutes with AI-powered generation, intuitive editing, and collaborative discovery.
Role
UX Designer
Duration
Dec 2025 – Feb 2026
Platform
Web App
Tools
Figma, FigJam
TimeScaled removes the friction from timeline creation. The goal is simple: enable anyone to create professional timelines in under 5 minutes, eliminating the 2+ hour manual process that existing tools demand.
For educators racing against lesson prep deadlines, students juggling assignments, and content creators building narratives, existing tools transform a simple task into a multi-hour project.
I conducted research with 37 participants across educator, researcher, and content creator segments, recruited from Reddit communities, survey platforms, and student networks, then synthesised findings through affinity mapping in FigJam.
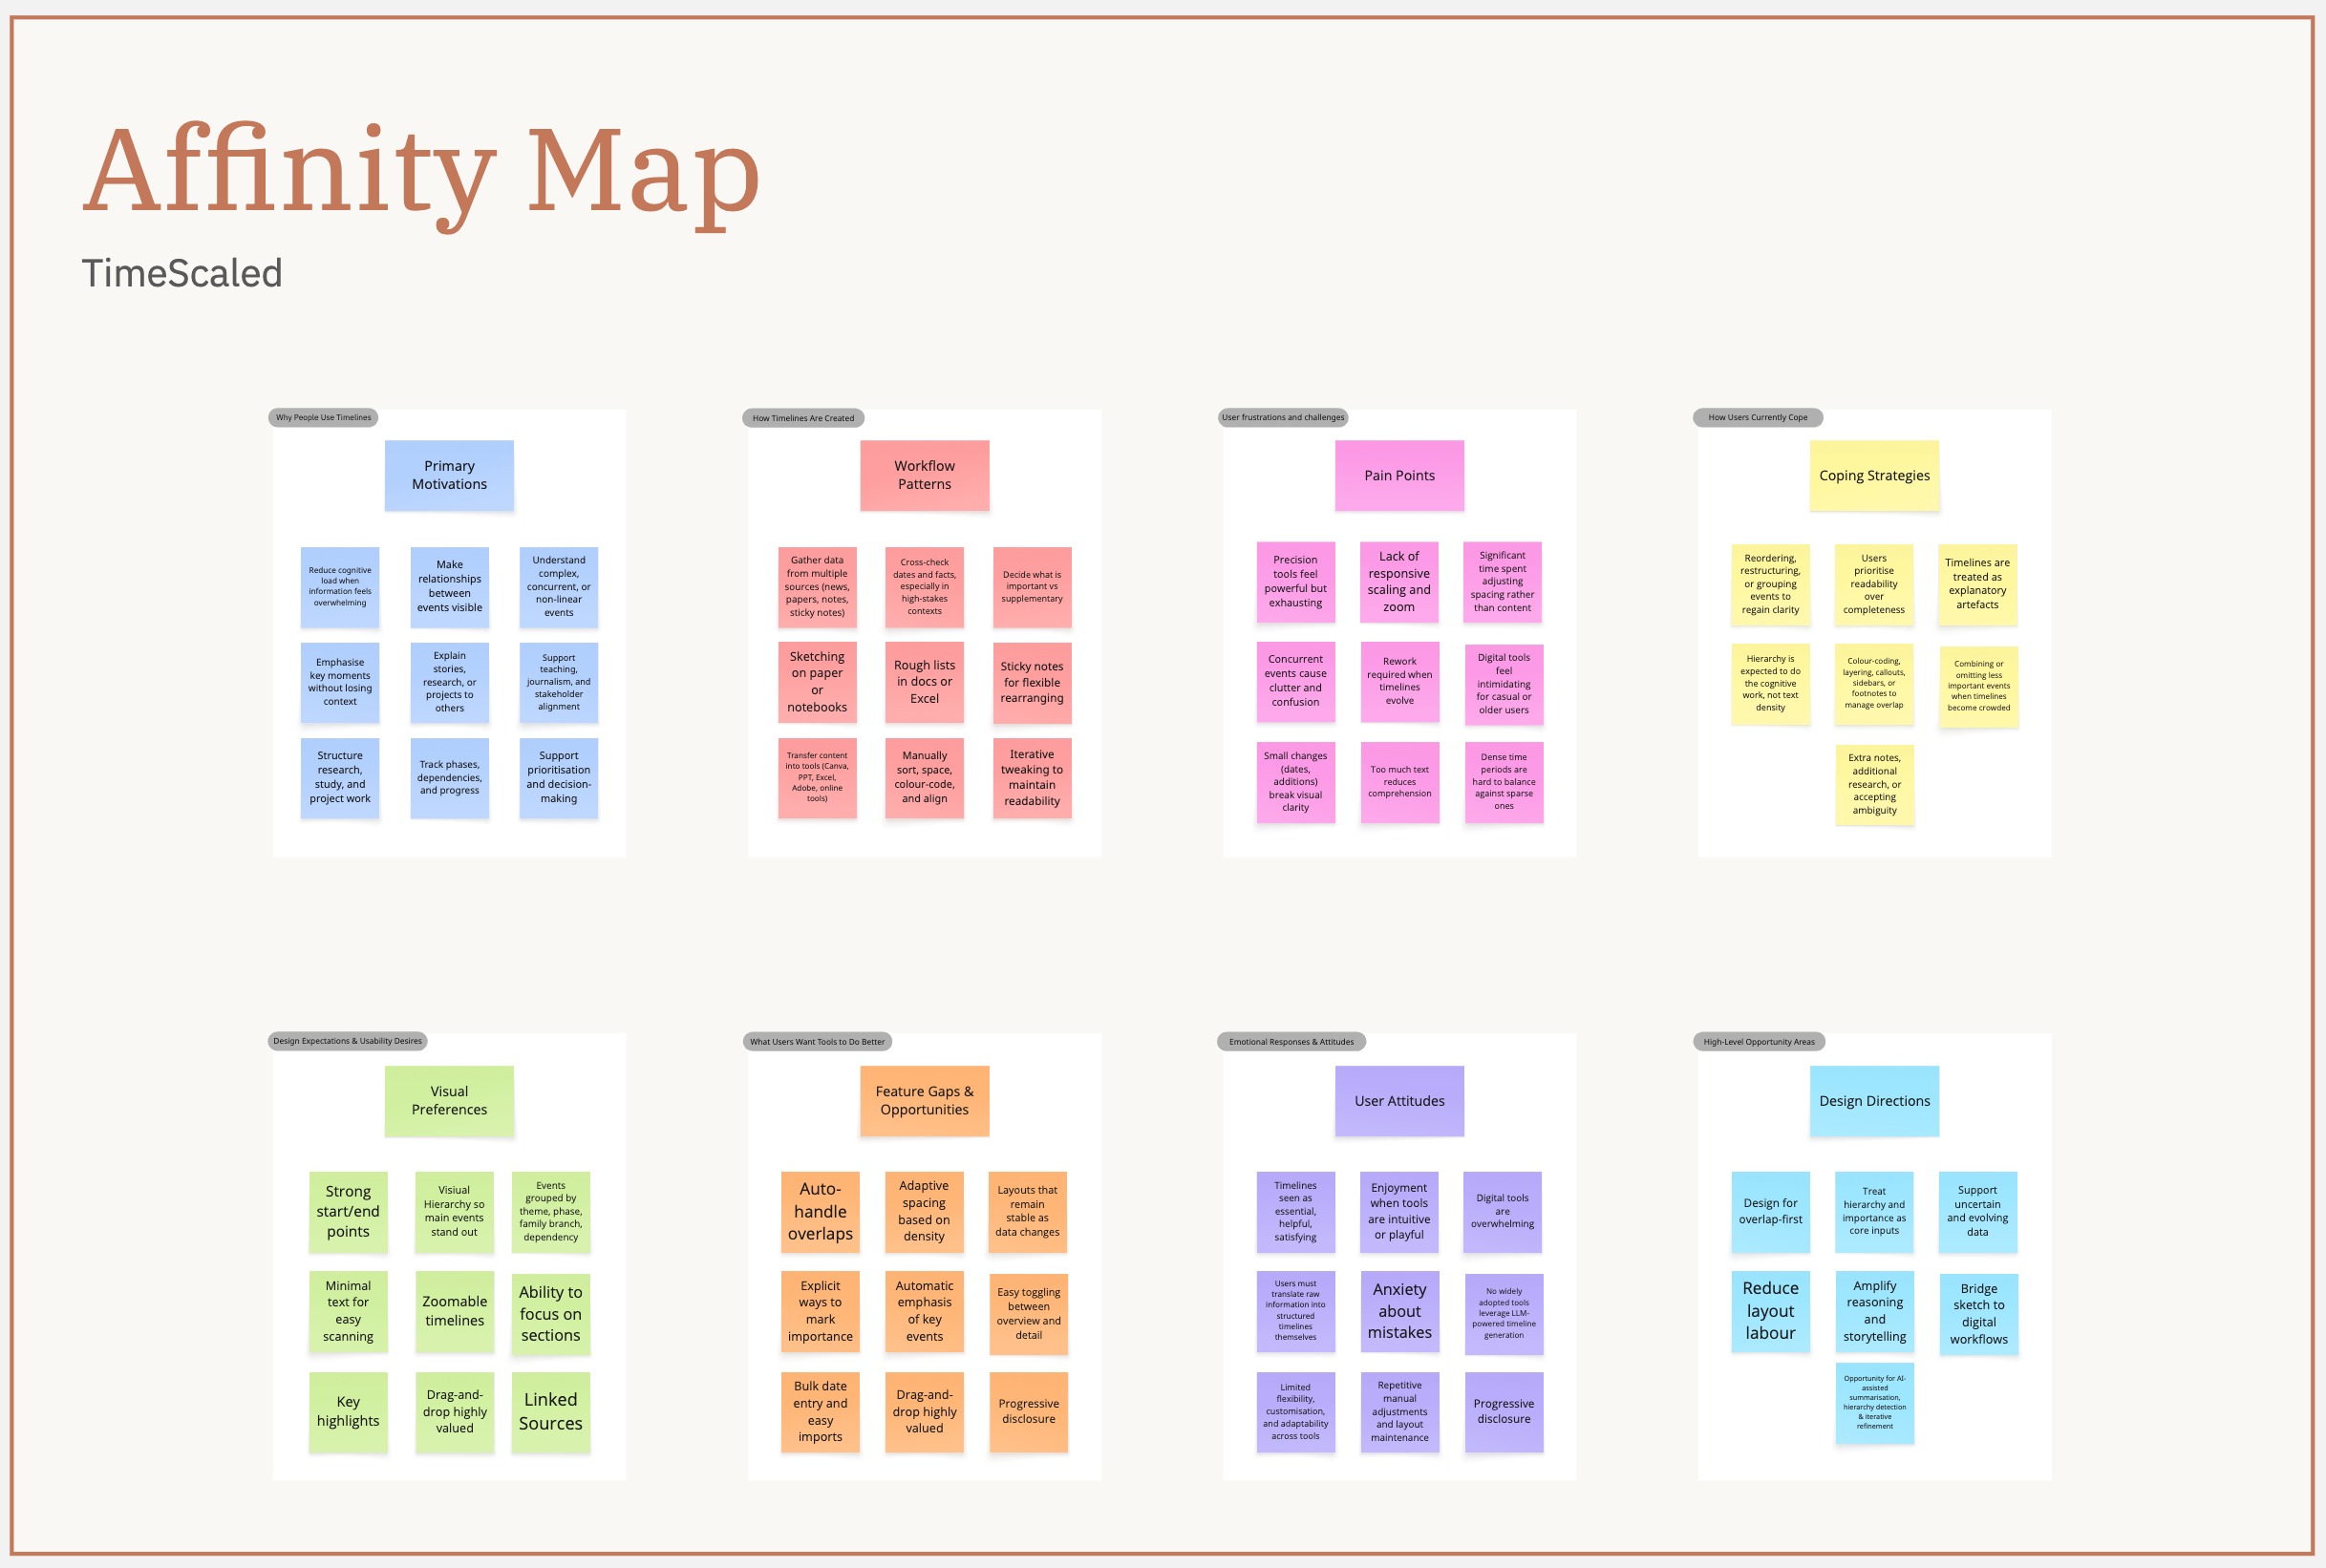
Affinity map from 37 user interviews

Empathy map for timeline users
73% found the process took far longer than expected for what should be a simple output. Every existing tool front-loaded complexity before delivering any value.
"I spend too much time manually adjusting layouts."
"I want to organise multiple events efficiently, see key events clearly, and avoid too much text."
"Overlapping dates are difficult - I can't always see which events take priority."
| Finding | Design Response |
|---|---|
| Hours of manual effort | AI generation from a single prompt, under 5 minutes |
| Tools feel overwhelming | Intuitive three-panel editor with progressive disclosure |
| Overlapping events | Auto-handle overlaps with intelligent spacing |
| No AI support | AI-powered generation with full manual override |
| Unprofessional outputs | Polished single-platform design, no tool juggling |
| No collaboration or discovery | Real-time co-editing + public Explore page |
The wireframing phase established the foundation for the product's information architecture and user flow. Three design principles guided every screen: reduce cognitive load, prioritise speed, and enable discovery.


The evolution from wireframes to final design involved strategic simplification. The landing page removed sidebar navigation to eliminate decision paralysis. The timeline editor condensed 12 toolbar buttons into 6 contextual tabs, reducing cognitive overload through progressive disclosure. My Timelines removed the redundant sidebar, prioritising visual scanning with a full-width card layout.
The visual language uses a warm terracotta accent (#D97757) with neutral greys, clean typography, and ample whitespace for clarity across educational, research, and creative contexts.

Design system spanning landing page, editor, library, explore, and sharing flows: terracotta primary (#D97757) with neutral grey scale, Inter type scale, 4px base spacing grid, and a reusable component library including buttons, inputs, cards, modals, timeline nodes, and collaborator avatars with consistent tokens for radius, shadow, and hover states.
The fastest way to create a timeline is to describe it. Users type a prompt like "Create a timeline of the Space Race from 1957 to 1975" and the system generates a structured timeline with key events, dates, and contextual information. The generation modal shows real-time progress through four stages: analysing the prompt, researching historical accuracy, organising the timeline structure, and finalising event details.

The interface is built around a three-panel layout: sidebar for navigation, canvas for the timeline, and details panel for event editing. Events display along a horizontal axis with clear date labels and visual markers. Clicking any event opens its details for editing: title, description, date range, category, and media.
The editor supports drag-and-drop reordering, inline text editing, and bulk actions.
Timelines aren't built in isolation. The sharing modal offers granular control: generate a shareable link, invite specific collaborators by email, or publish to the public Explore feed. Collaborators can be assigned view-only or edit access.

Invited collaborators appear in the timeline header with avatars, showing who's currently editing. Changes sync in real-time, similar to Google Docs, but optimised for timeline-specific interactions.
The Explore page transforms TimeScaled from a tool into a platform. Users can browse timelines by category (History, Science, Technology, Pop Culture), view trending timelines, or search by keyword. Each timeline preview includes engagement metrics: views, favourites, and creation date.
A personal dashboard to manage all timelines, filterable by status with quick actions on each card.
Accessibility was designed in, not bolted on:
By collapsing a 2+ hour manual process into under 5 minutes, TimeScaled lets users focus on storytelling instead of layout.
TimeScaled is currently in MVP development with beta testing scheduled for March 2026 and public launch targeted for April 2026.
10K+
Target users in first 6 months
<5 min
Average timeline creation time
Apr '26
Planned launch
Speed is the feature
Users don't want timeline tools. They want timelines. Every feature was evaluated through the lens of "does this get users to a finished timeline faster?" AI generation, direct image uploads, real-time collaboration, and public templates all serve this goal.
Collaboration requires transparency
Real-time collaboration only works when users can see who's editing, what changed, and how to resolve conflicts. The solution combined technical infrastructure with interface design: prominent collaborator avatars, inline change indicators, and graceful merge conflict resolution.
Discovery creates retention
Timelines are inherently shareable artefacts. By building Explore as a core feature rather than an afterthought, TimeScaled transforms from a utility into a platform. Users return not just to create, but to browse, learn, and find inspiration. This network effect will be critical for long-term retention and growth.